


When I engage with some of our users and customers, one recurring question I face is this:
I have a Shared Mailbox where my agents answer incoming emails from the same inbox. Can Email Meter show statistics for the performance of each agent?
At first I was surprised by the number of teams that seemed to have a similar setup – but then I understood: there is a clear advantage in having your team work together in a process or a mailbox without having to use a third party tool. Just using, well... Email. Bear in mind it's free, there's no training required, no unknowns. Email works like a charm and our customers and users are completely happy with it.
We started to see a pattern where multiple teams in Sales, Customer Service, HR or even Internal Support and Training were using a Shared Mailbox within Gmail.
We also noticed how some of them used Google Groups or even worse... They just shared a password. We started recommending the use of Delegated Mailboxes, a feature that the Gmail team built specifically for these use cases.
The next step was clear: let's get statistics for the performance of each agent.
Let's look at how Email Meter Enterprise helped a Customer Service team of 12 people. Goals and performance indicators for agents were set by implementing analytics for their shared mailbox. Let's use fictional data this time!

We quickly agreed on the setup, so it was time to go ahead and put our hands into the data. We loaded one year of data for the orders@ account, enabled real-time monitoring and then used Google Data Studio to analyze the data.
We came up with this dashboard:
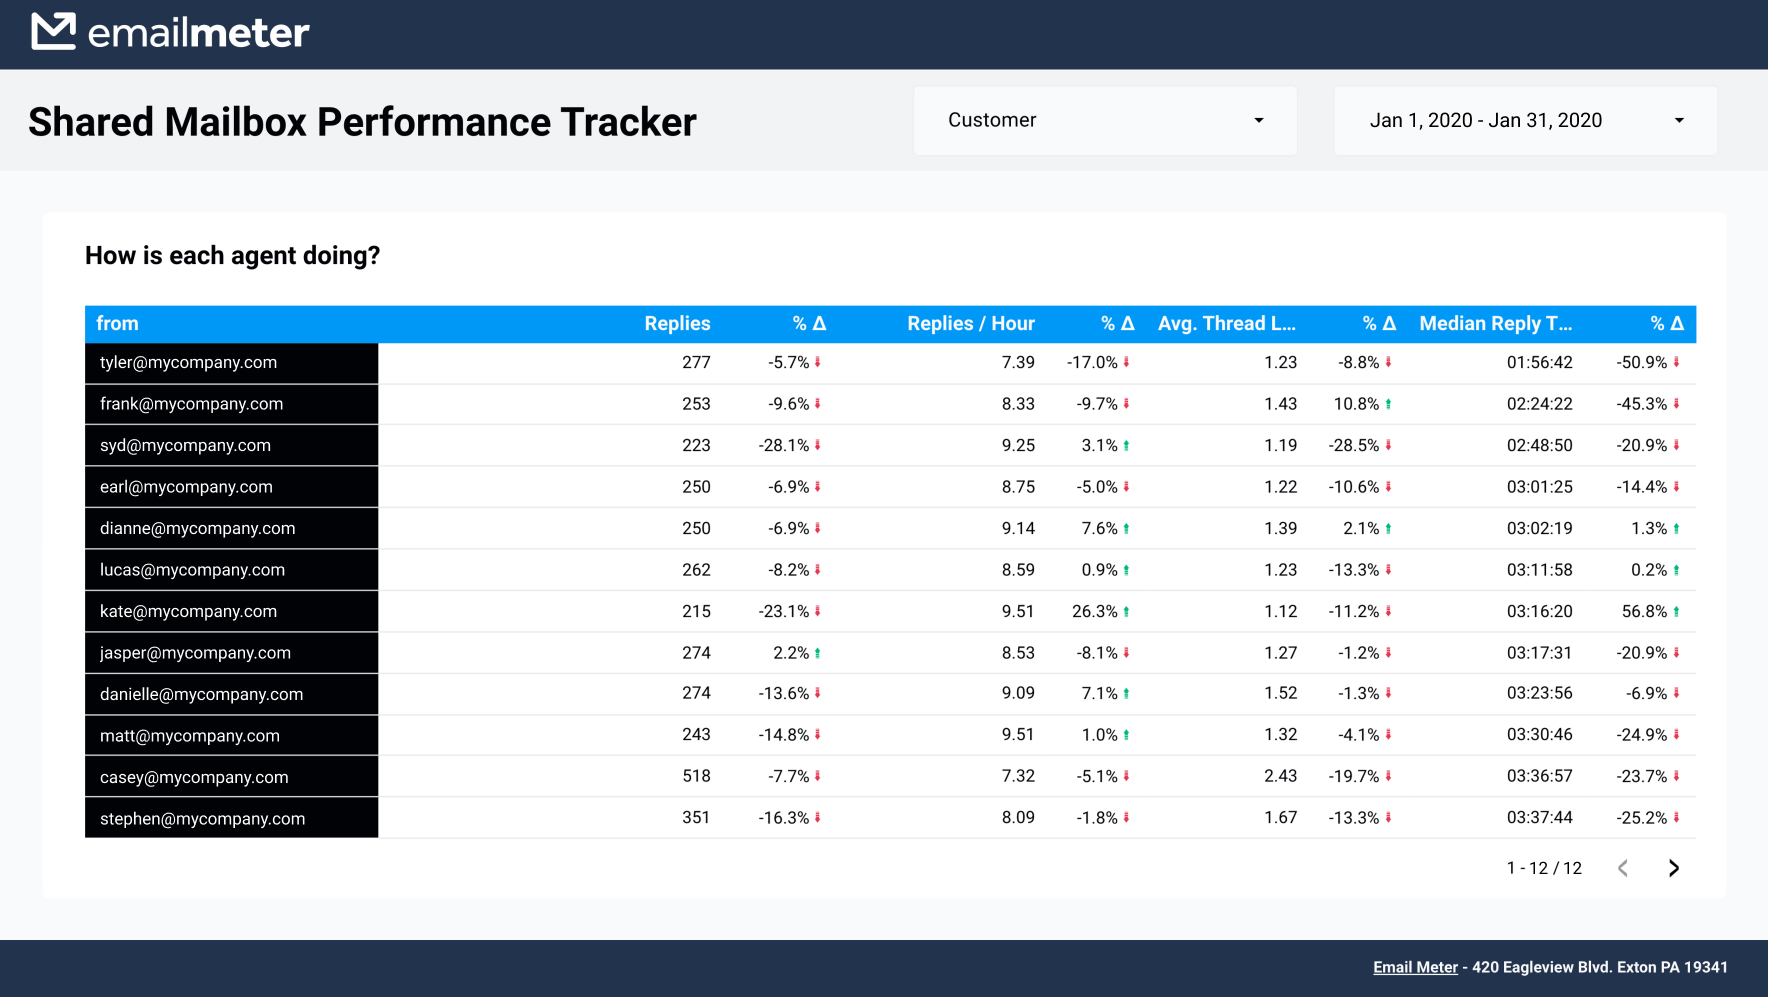
Notice how we're now aware of the individual metrics for each agent:
- Nº of replies: Useful for estimating how much of the workload within the mailbox each agent is taking.
- Nº of replies/hour: By blending agent's work shifts with the data we get a more representative number, which is easier to compare.
- Avg. Thread Length: Is any agent prone to long, messy threads? Has that increased or decreased? Long threads are usually a sign of bad service, so we're looking to decrease this indicator.
- Median Response time: A top-notch performance indicator. You don't want to make your customers wait!
Lastly, we added comparisons to each of the metrics, and gave agents their own dashboard for their own data — a major step towards accountability, giving everyone a way to check their success.
The manager now has a solid dashboard which updates with fresh data every day, helping him strive for his target of reducing agent response time!
Are you using a Shared Mailbox? Do you want to measure individual agent performance?


