Do you have a number of people working with you, and no way to track their email statistics?
This is essential if you want to know:
- How many emails are sent and received, both overall and by each team member.
- How long it takes your team to reply.
- Who the top performer in your team is.
- When peaks and valleys of workload are expected.
The best way to keep track of all this is with a dashboard where you can regularly track it all from one place.
Let’s explore how you can get started with Email Meter Teams, and what you can use it for.
Creating your Email Meter Teams Dashboard
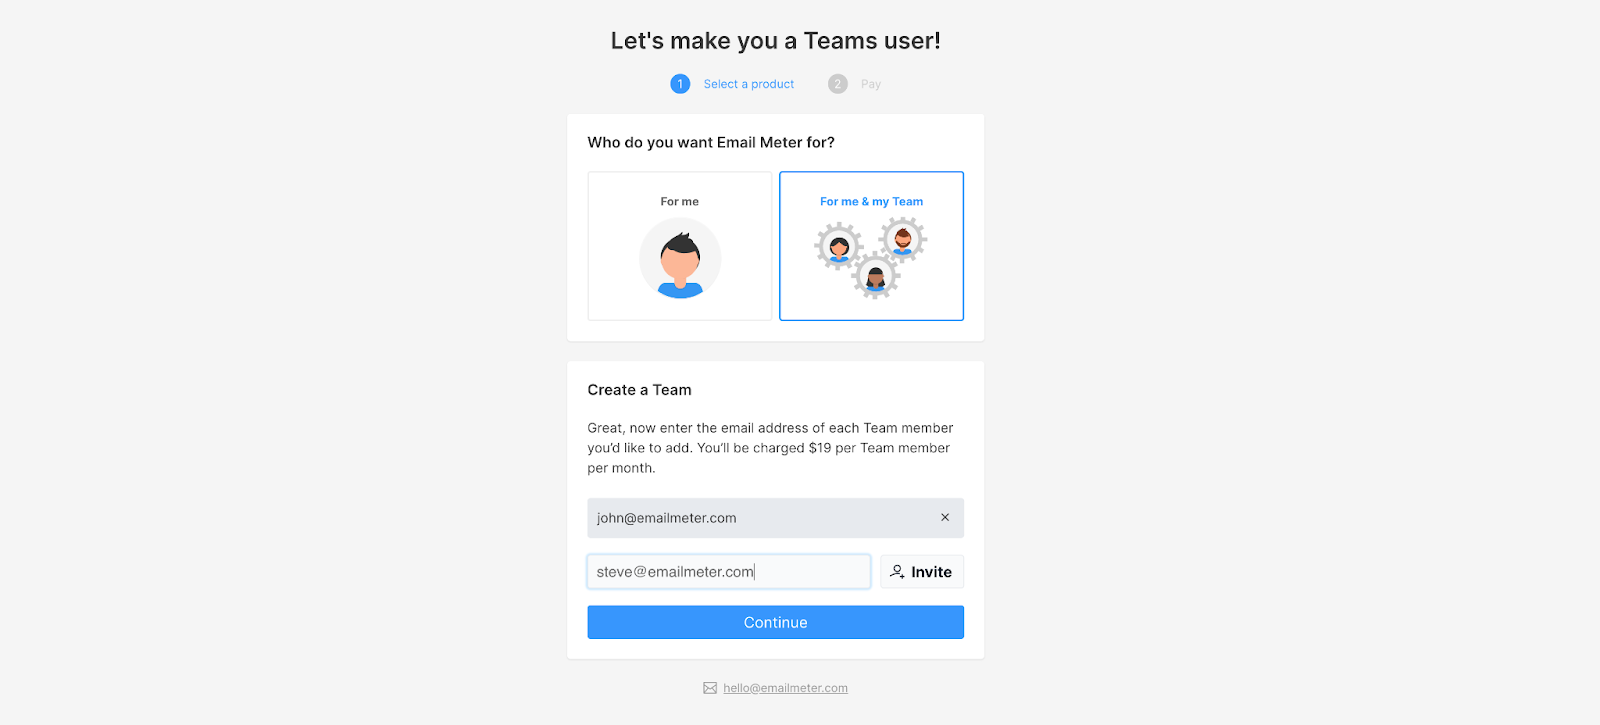
You'll want to get started by setting up your dashboard. Go to Email Meter and click on Teams on the left. You’ll be able to invite all your team members from here!

Once your team invites are sent, your team members will need to accept them. They can do this either by logging into Email Meter, or by following the link which is emailed to them.
You can now access your team’s stats by clicking on ‘My Team’ on the left-hand sidebar of your dashboard!
From here you can see each team member, along with some basic stats. You’ll also see a team average which helps you understand what the standard for your entire team is.
What can I use ‘My Team’ for?
This is the best place for daily check-ins and to make sure everything is running smoothly. You’ll be able to see how much each team member is above or below the average with a percentage, which is great for understanding how performance differs. Sort by each column for a better understanding of who is leading for each statistic.
Getting a more in-depth understanding
Now that you’ve got your daily check-ins covered, let’s look at how you can dive into your data and see specific details for each team member. You can create an entire report for any date and combination of team members, along with some other useful filters that let you hone in on the exact information you need.
Go back to the main page of Email Meter by clicking on ‘Report’ in the sidebar. You’ll see a report for yourself for the last month by default. Using the filtering bar at the top, you can choose any number of team members you want to include in your report.
Some examples of how you would use an in-depth report include:
- Looking at one specific day in the past, for one specific team member, to check a metric not included in the ‘My Team’ section.
- To export CSV raw data to use in a spreadsheet or BI software.
- To check the performance of a team member for an entire year, quarter or month.
Using filters to find exactly what you need
You can take your analysis even further by applying some filters. These remove certain emails from your report to show you only what’s most relevant.
Some examples of how you can use filters include:
A whole report including emails from only one specific address or domain. Find out how many emails your most needy client sends you, or see how long your response time is to an important contact.
You can do this by applying this filter, choosing either ‘Domain’ or ‘Address’:

A report including only internal emails, allowing you to see how well your organization communicates, or how long your internal response time is compared to your overall response time.
To see only intra-domain emails, apply the following filter:

See the number of emails with a specific word in the subject line, to better understand which topics are being discussed most often by your team.
To see all emails which contain this word or set of words in the subject line, you can apply the following filter:

We hope this outline has given you an idea of how you can use a team dashboard to find the information you need, and shown you some valuable insights.
Do you have a problem you’re unsure of how to tackle?
Get in touch with us now and we’ll be happy to find a solution, commitment-free.


